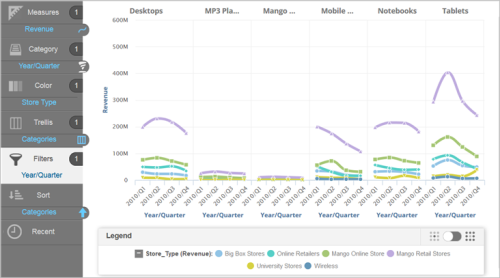
Use trellis charts to identify patterns and trends across a series of charts.
Tip: Since a trellis includes smaller charts, it is recommended to start with
simple charts that are easy to understand and compare.
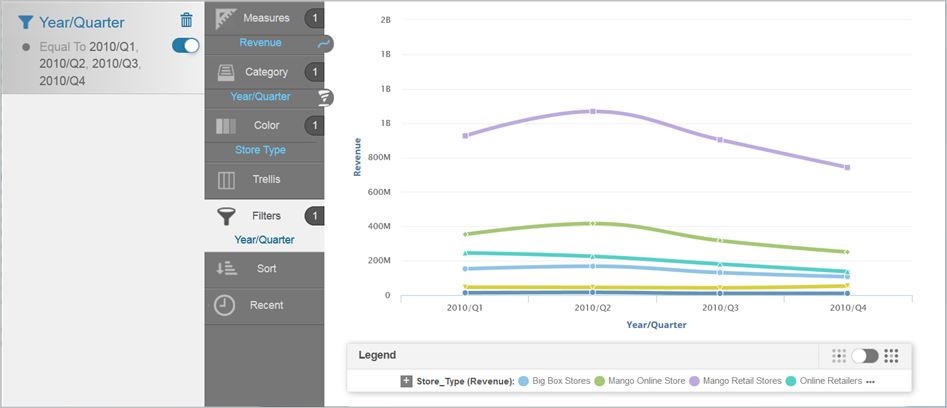
- In Visualizer, add one or more measures and attributes to plot a chart.
- Add an attribute in one of the following ways:
- Drag and drop the attribute on one of the suggestions;
- Drag and drop the attribute on Trellis in the Chart Builder.
 Tip: To remove a trellis chart, drag the attribute from Trellis in the Chart Builder and drop it on Trash in the subject area.
 - Click Trellis
in the Chart Builder to see the different options for trellis charts.
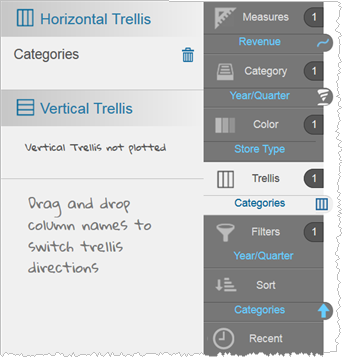
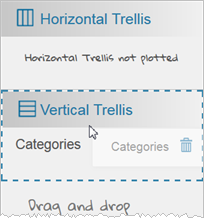
 Optional: Change to a Vertical Arrangement
- Drag and drop Categories from the Horizontal Trellis area to the Vertical
Trellis area.
- Drag and drop Categories from the Horizontal Trellis area to the Vertical
Trellis area.
- Click Save.